Architecture |  |
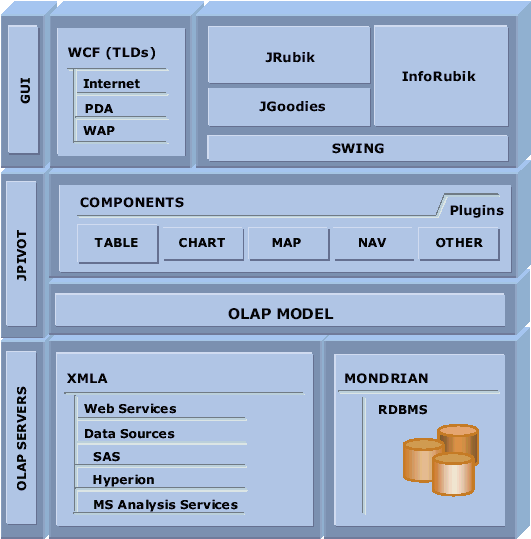
1. Layers and Components

2. Plugin structure
The main application and the rest of components are deployed using plugin pattern. The plugins are stored in the directory: ./lib/plugins. A plugin could be removed from the application just moving the corresponding .jar files from the plugin directory.
3. Components
The table component is the main application viewer, it allows to the user to work with the olap result data in a tabular form. We can navigate through dimensions, hierarchies, members, change the order, drop dimensions .... The interactivity level of this component is similar to the JPivot equivalent one, but there has been added some new functionalities like draq&drop support (for moving dimensions and members, change the axis of a dimension, drop elements ...). The data showed by this component can be printed and export to PDF, XML, HTML and Excel format (or could be copied to the clipboard).
The chart viewer uses the JFreeChart package for rendering all kind of charts (pie, columns, line, 3D ...). At this moment this component doesn´t allow any navigation or olap interactivity. All the rendered charts can be printed or exported to XML and HTML format (you can copy&paste too).
The navigation tree lets the user to select the dimensions of the olap query without to write the olap query directly. All the component selections have a direct MDX translation that can be viewed or modified using the MDX query editor component. This component has drag&drop and popup menu capabilities.
The user could store the favorites queries as bookmark for future use. There are predefined menus that use the same storage method, but they can´t be modified by the user inside the application (A simple method for customize your menus is to create the bookmarks first and then copy the files and folder from ./resources/marcadores/user_name to ./resources/mdxmenu).
The map component render in a specified map the olap data composed by various measures or a single dimension cross-joined with a geographical dimension. In order to define the geographical dimension you´ve to specify it in the Mondrian schema using a parameter tag. See the Foodmart schema included in the ./resources/catalogs folder and look at the Customers dimension in Sales cube. New map files could be added to the folder ./resources/map/maps. Currently this component doesn´t support multiple geographical dimensions in the same cube. Remember, for Map visualization is necessary to install the Adobe SVG Viewer 3.x plugin.
There is another basic statistical data summary frame that allow to taking a look at the statistical values of the current olap query result. This is an alfa version component and it hadn´t been tested intensively.
The "Drill-through" component is used for showing the original data used to calculate and aggregated value. The working method is similar to the JPivot Drill-through. The viewed data could be impressed and exported to PDF, XML, HTML and Excel format (or copied to the clipboard too).
Other elements: The memory monitor is based in the org.apache.batik.util.gui.MemoryMonitor from Batik.
